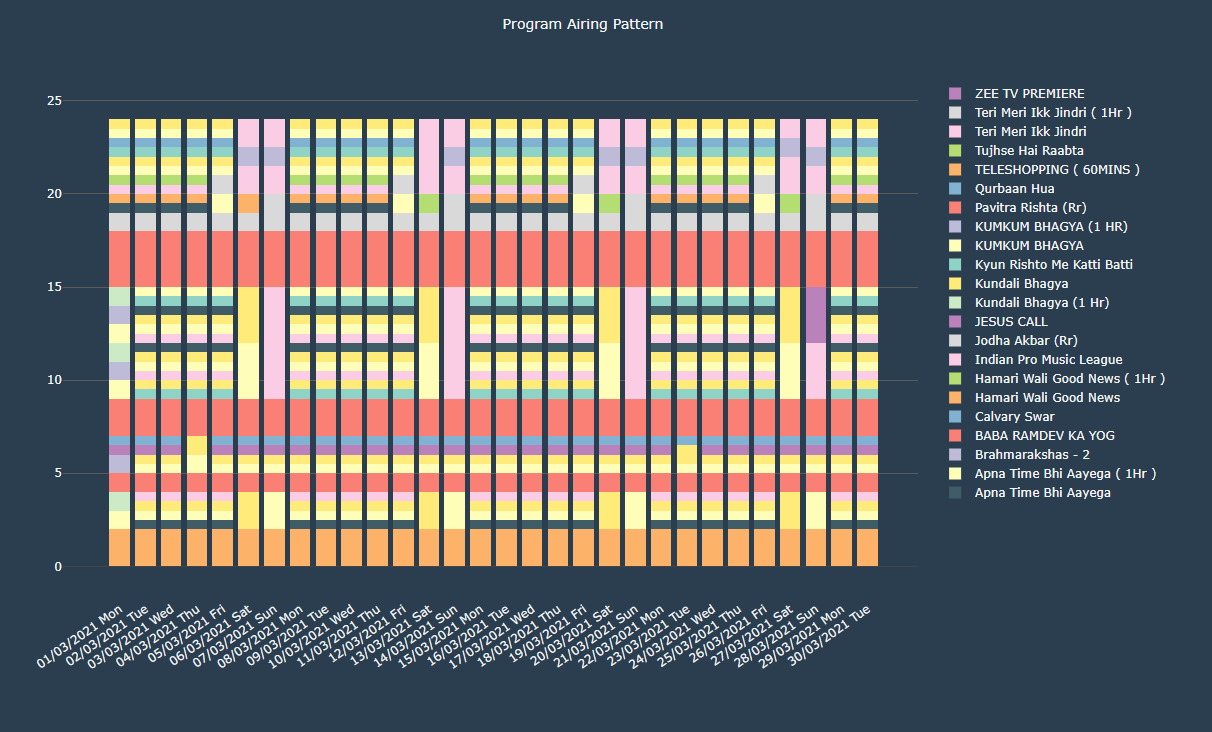
- The graph shows the program appeareance in the given month
- The x-axis shows the date and day of the month
- The y-axis shows the hour number
- The bars show the airing pattern of the programs which are assumed to be followed over the month.
- Empty spaces indicate absence of any program in the given hour/time
- The graph aids in finding any mismatch in the airing pattern.
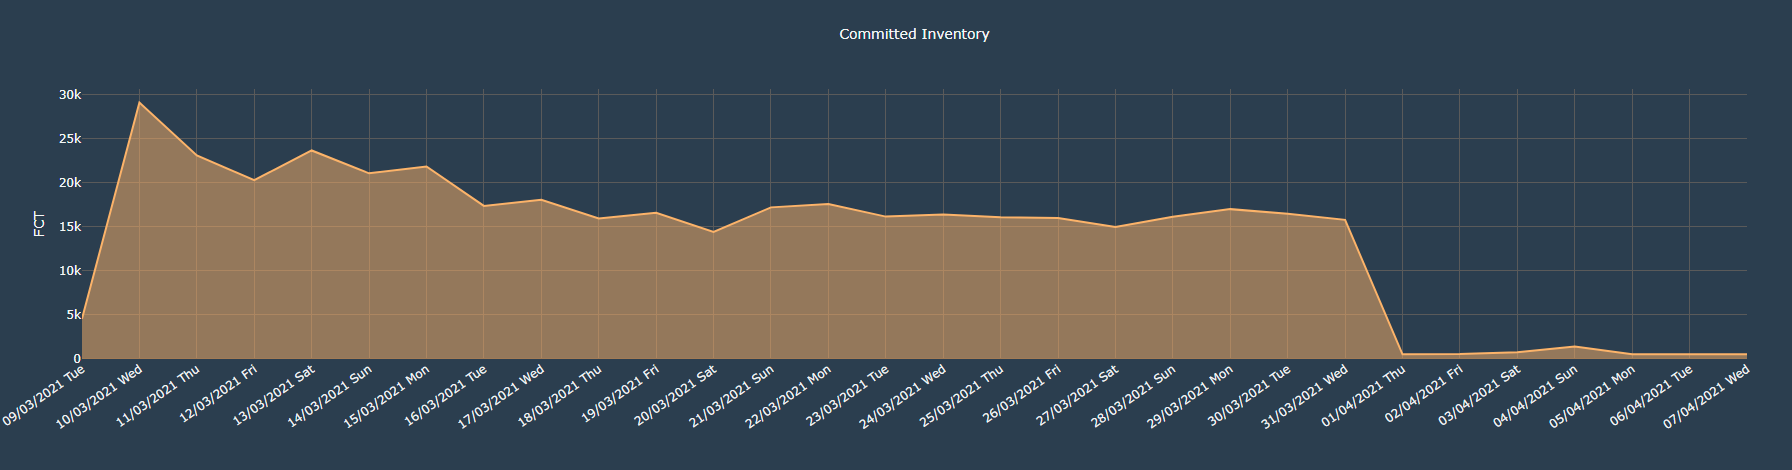
- The graph shows the booked FCT for the given date
- The x-axis shows the date and day of the month
- The y-axis shows the range of the FCT values
- The graph shows the committed FCT over the given time period.