Indexing
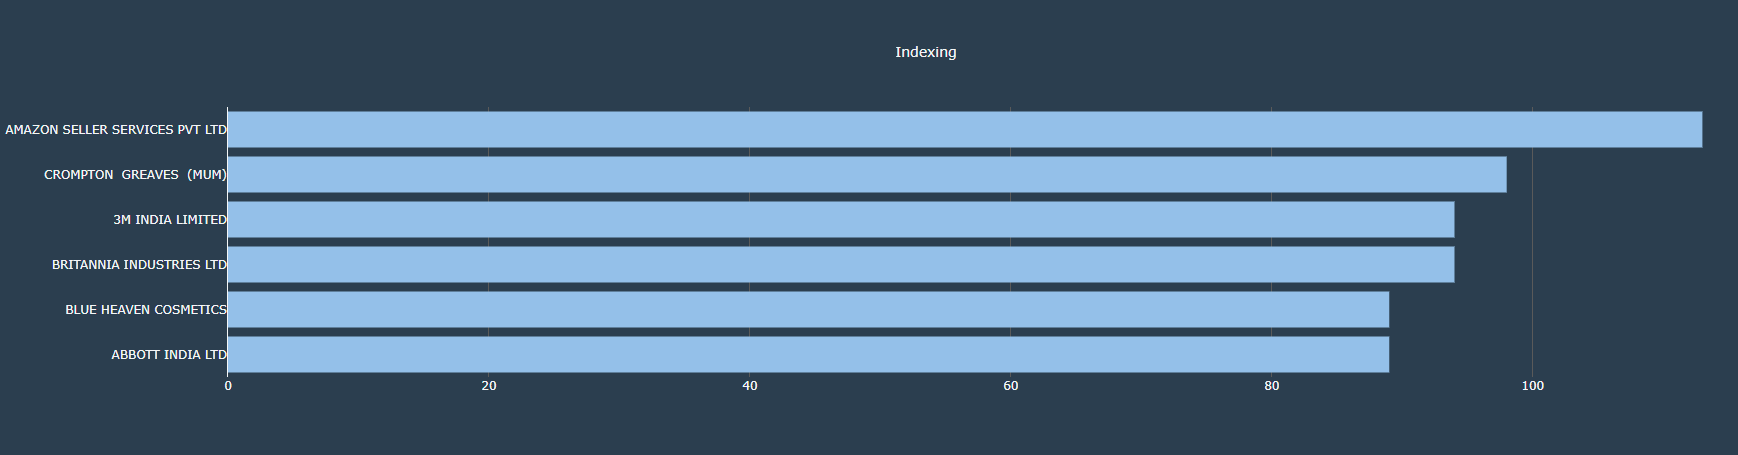
- The graph shows the scores for the selected clients
- The x-axis shows the range of scores
- The y-axis shows the different clients
- The bars compare the score given to the client which is based on the ER provided by the client for the similar sales unit
- So, higher the score higher the ER is provided by the client(overall)